


Macroeconomic Intelligence for Market Research.
Follow inflation, interest rates, growth and employment data, read central bank announcements in context, and keep track of the economic events ahead.
Follow inflation, interest rates, growth and employment data, read central bank announcements in context, and keep track of the economic events ahead.
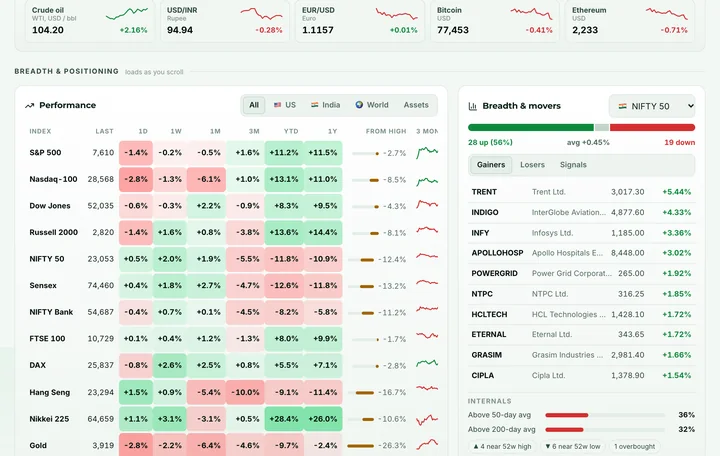
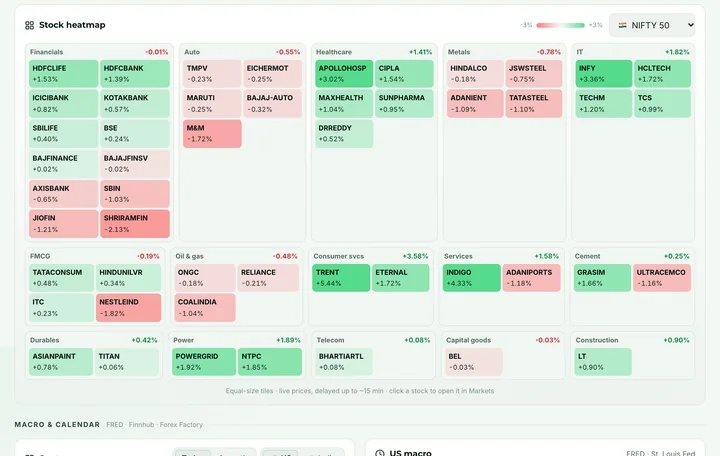

Inflation shapes costs and pricing power, interest rates shape borrowing and valuations, and employment shapes demand. The macro module is designed to put these indicators, and what central banks say about them, alongside the rest of your research.
 Indicator dashboards with history, not just the latest printCentral bank statements summarized and linked to the originalAn events calendar for upcoming releases and meetingsAI explanations of what each indicator measures
 In development

Product status: Quantzivo AI is in development. Features described here reflect the planned scope and may change before release.

Headline and core consumer prices, producer prices and their trends over time.

Policy rates and government bond yields across maturities, including the shape of the yield curve.

Rate decisions, statements and minutes, with AI summaries that link to the published text.

Output growth plus timelier activity measures such as purchasing managers' surveys.

Unemployment, job creation and wage measures that describe the state of the labor market.

A calendar of upcoming data releases and central bank meetings, filterable by economy and type.

Compare indicators across economies where data is available, with notes on how definitions differ.

Ask what a release measures, how it is calculated and how it compares with earlier readings.
Names, methods and release schedules vary between economies. This guide describes each indicator in general terms.
| Indicator | What it tracks | Why researchers watch it |
|---|---|---|
| Consumer price index (CPI) | The change in prices of a basket of consumer goods and services | The headline inflation measure; central to policy decisions and real (inflation-adjusted) returns |
| Core inflation | CPI excluding volatile items, typically food and energy | A steadier view of underlying price pressure that central banks often emphasize |
| Producer price index (PPI) | Prices received by domestic producers for their output | An early view of cost pressures that may later reach consumer prices and margins |
| Policy rate | The short-term interest rate set by the central bank | Anchors borrowing costs across the economy and influences valuations and currencies |
| Government bond yields | The return on government debt across different maturities | The yield curve's shape reflects expectations for growth, inflation and future policy |
| Gross domestic product (GDP) | The total value of goods and services produced in a period | The broadest measure of economic growth, though released with a lag and often revised |
| Purchasing managers' index (PMI) | Survey of business conditions; readings above 50 usually indicate expansion | A timely signal of activity that arrives well before official output data |
| Unemployment rate | The share of the labor force without a job and looking for work | Indicates slack in the labor market and potential pressure on wages |
| Employment change | The number of jobs added or lost over a period | Shows hiring momentum; often one of the most closely followed releases |
| Retail sales | The value of sales at retailers | A read on consumer spending, a large component of many economies |
Find the event in the calendar, review the previous readings and ask the assistant what the indicator measures.

Compare the new figure with its history and note any revisions to earlier periods.

For policy meetings, read the AI summary of the statement, then the statement itself via the source link.

Look at related news and sentiment, and note what the data might mean for the companies on your watchlist.
Sentiment AnalysisCentral banks communicate through several kinds of documents. Small changes in wording between them are often studied closely, which is where AI-assisted comparison is designed to help.
The policy decision and the short statement explaining it, published at the end of each meeting.
Longer documents released later that describe the discussion and the economic outlook in more depth.

Remarks by policymakers that add color to official statements between and after meetings.

First estimates of GDP and employment are often revised, sometimes substantially.

Year-over-year rates can swing because of what happened a year ago, not what is happening now.

Economies define and measure indicators differently, which complicates cross-country comparison.
Check whether a series is seasonally adjusted before comparing one month with another.

Explanation, not forecasting. The macro module describes and explains published data and statements. It does not forecast economic releases, policy decisions or market reactions, and it does not provide investment advice.
Request early access to the macro module, or compare the planned Quantzivo AI plans to see which fits how you research.