


Explore Financial Markets with AI-Powered Intelligence.
Unify market data, technical research, financial fundamentals, news intelligence, market sentiment, and economic insights in one analytical workspace.
Unify market data, technical research, financial fundamentals, news intelligence, market sentiment, and economic insights in one analytical workspace.
Market research usually means a charting tool in one window, filings in another, news in a third and an economic calendar somewhere else. Quantzivo AI is designed to bring those views together, with an AI assistant that explains what you are looking at and links back to where the information came from.
 In development

Product status: Quantzivo AI is in development. Features described here reflect the planned scope and may change before release.
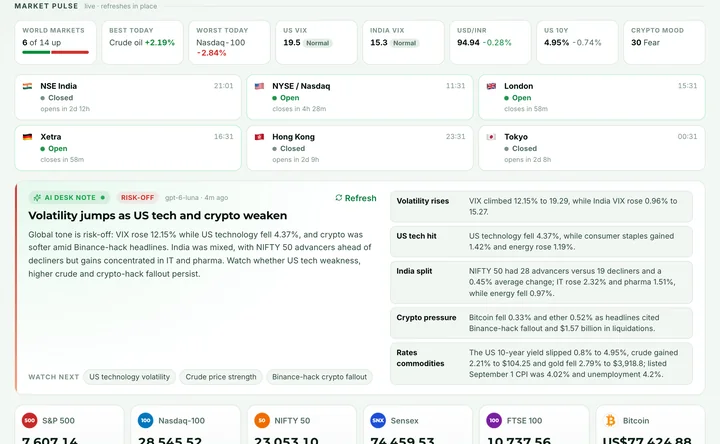
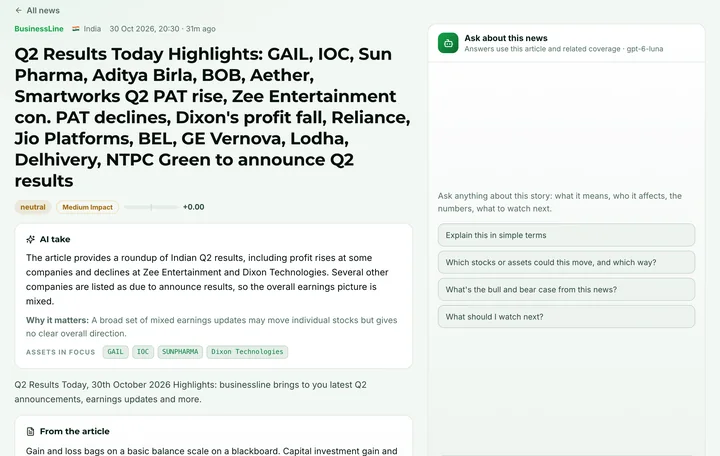

Real screens from the product in development. Pick a screen to see what it covers.

Market pulse, exchange hours and an AI desk note that summarises the day's tone with the figures behind it.

Charts with indicators, market and index switchers, and a watchlist for each region.

Rule-based buy and sell signals with entries, targets and stops, plus an AI note when signals keep flipping.

Option chains with expected move, implied volatility, put/call ratio and an AI read of positioning.

Practise with virtual money on delayed prices. Stops, targets and limit orders are checked every minute.

Live headlines from several sources, de-duplicated, tagged by sentiment and impact, with an AI brief.

Open any story and ask what it means, which assets it touches and what to watch next.

Multi-agent research reports: a decision, the analyst team's sections and the reasoning, all in one place.
Screenshots of the current build. Market figures are from the moment of capture, shown for illustration only and not investment advice.
Each module works on its own and shares context with the others, so a chart, a filing and a headline about the same company sit side by side.

Charts, indicators, multi-timeframe views and screening, with explanations of what each study measures.
Learn more
Financial statements, margins, valuation ratios and peer comparisons laid out over time.
Learn more
Headlines and announcements, categorized by topic, with AI summaries that link to the original source.
Learn more
Classify the tone of financial news and follow how it shifts across companies, sectors and events.
Learn more
Inflation, interest rates, growth and employment data alongside central bank announcements and an events calendar.
Learn more
Ask questions in plain language and get explanations, summaries and comparisons that show their working.
Learn more
Group the companies, sectors and indicators you follow so news, sentiment and data are filtered to what matters to you.

Save charts, tables, AI answers and your own notes against a research question and return to them later.

Start a workspace around something specific, such as how a company's margins compare with its peers, and add the instruments to a watchlist.

Pull up the chart, the financial statements, recent headlines and the relevant economic releases without leaving the workspace.

Ask the assistant to explain a ratio, summarize a filing or compare two companies, then follow its links back to the underlying data.

Check key figures against the sources, write down what you concluded and what remains uncertain, and save it for next time.
Most questions touch more than one module. This map shows where each kind of question usually begins.
| Module | Questions it helps you explore | What you work with |
|---|---|---|
| Technical Analysis | How has price behaved? Is volatility higher or lower than usual? How do daily and weekly views differ? | Charts, indicators, screens, dashboards |
| Fundamental Research | How has revenue grown? Are margins improving? How does valuation compare with peers? | Statements, ratios, peer tables, trend charts |
| News Intelligence | What has been announced? What changed in the company's guidance? Which stories mention my watchlist? | Categorized headlines, AI summaries, source links |
| Sentiment Analysis | Has the tone of coverage shifted? How did coverage change around an event? | Sentiment labels, trend dashboards, article drill-downs |
| Macroeconomic Research | What is happening to inflation and rates? What did the central bank say? Which releases are coming up? | Indicator series, statement summaries, events calendar |
| AI Research Assistant | What does this metric mean? Can you summarize this? How do these two compare? | Natural-language answers with linked data and sources |
AI is useful for reading, organizing and explaining large amounts of financial information. It is not a substitute for your own judgment, and it is not designed to tell you what to trade.
Answers are designed to show which data, time period and method were used, so you can see how a result was reached.

News summaries and factual claims link back to the original material, so the summary is a starting point rather than the final word.

Quantzivo AI explains and summarizes. It does not predict prices, issue buy or sell recommendations or give personalized advice.

Where data is missing, stale or ambiguous, the assistant is designed to say so instead of filling the gap with confident guesses.

Explanations focus on what a measure means and where it can mislead, so you understand the reasoning, not just the output.

The workspace records your notes and conclusions. Decisions about what to do with your research remain yours.

AI output can be wrong. Language models can misread documents, mix up figures or state errors confidently. Verify important numbers against the linked sources before relying on them.

Connect what you learn about ratios, indicators and economic data to real examples, with explanations at every step.

Bring technical, fundamental, news, sentiment and macro context into one workspace and keep a record of how you reached a view.

Use research to form hypotheses, then take them to Quantzivo Studio to express as rules and test on historical data.
Three monthly plans are planned, from learning-focused research to higher-usage workspaces.
 Core research toolsLearning-focused workspaceUsage limits applyAdvanced research featuresExpanded analytical usageEverything in StudentHigher usage limitsAdvanced research workspacesEverything in Professional
Illustrative pricing for planning purposes. Final plans, limits and prices will be confirmed at launch.
What the platform is designed to do, what it will not do and how to follow its progress.
Quantzivo AI is in development. Request early access to hear about previews, or book a demo conversation to tell us how you research markets today.


